Dove siamo e Prove tecniche
Presentazione
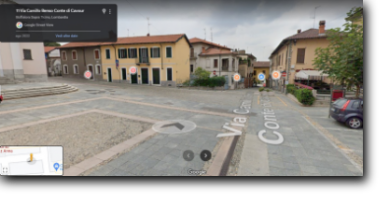
La nostra Associazione ha sede presso la Biblioteca civica in Piazza Castello
Viale Mazzini è la via d'accesso più semplice per raggiungerci
Utilizza la mappa visualizzata per venirci a trovare.
PROVE TECNICHE


import matplotlib.pyplot as plt
import numpy as np
# Data
age_groups = ["<60", "60-64", "65-69", "70-74", "75-79", "80-84", "85-90"]
male_counts = [18, 44, 49, 42, 25, 10, 2]
female_counts = [3, 9, 14, 14, 13, 6, 1]
# Create a stacked bar chart
bar_width = 0.5
index = np.arange(len(age_groups))
fig, ax = plt.subplots(figsize=(12, 8))
bar1 = ax.bar(index, male_counts, bar_width, label='Male', color='b', bottom=female_counts)
bar2 = ax.bar(index, female_counts, bar_width, label='Female', color='r')
# Labeling, title and legends
ax.set_xlabel('Age Groups')
ax.set_ylabel('Number of Volunteers')
ax.set_title('Distribution of Volunteers by Age Group and Gender')
ax.set_xticks(index)
ax.set_xticklabels(age_groups)
ax.legend()
# Display the graph
plt.tight_layout()
plt.show()